Most traders look at the chart and try to guess what happens next.
But the traders who grow fast are the ones who learn how the market actually moves, not just what a candle looks like.
Smart Money Concepts (SMC) gives you that understanding.
It shows you how price really behaves, why it moves the way it does, and where the high-probability opportunities appear.
If you’re learning this, you’re already ahead of most of the market.
Let’s break down the core SMC concepts in simple, clean language — the way professionals understand them.
1. Market Structure — The Flow of the Market
Everything in SMC starts with structure.
Price moves in waves:
- Uptrend → Higher Highs & Higher Lows
- Downtrend → Lower Highs & Lower Lows
Understanding this tells you:
- Who controls the market
- Where continuation is likely
- Where reversals may begin
Market structure is the map.
Without it, nothing else makes sense.
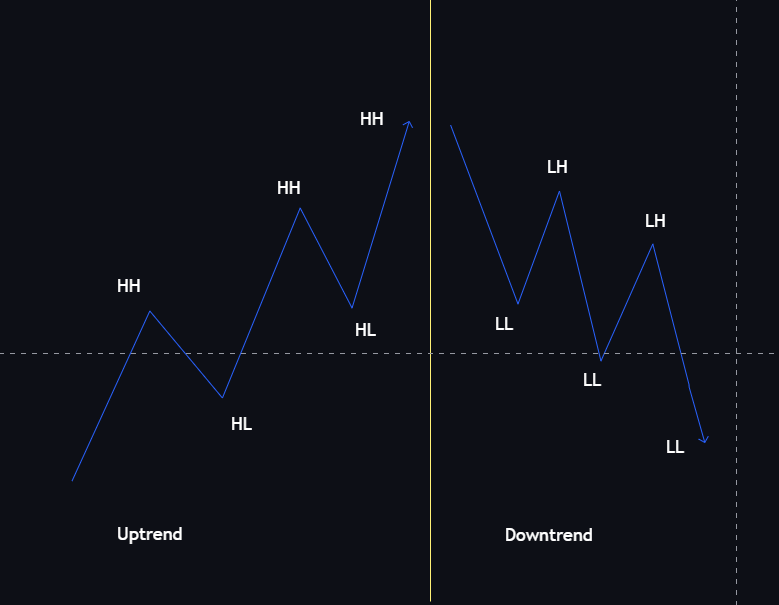
An uptrend is nothing mystical — it’s a repeated pattern of buyers winning small battles and pushing price to new highs. The price climbs, pulls back a little, then climbs again to a higher point. Those repeating peaks and troughs create a clear, measurable structure.
Simple sequence for an uptrend:
- Price makes a swing high.
- Price pulls back but stops above the previous swing low → this is a Higher Low (HL).
- Price moves up and makes a new swing high higher than the last → this is a Higher High (HH).
- Repeat HL → HH → HL → HH.
Downtrend is the mirror:
- Price makes lower highs (LH) and lower lows (LL) repeatedly: LH → LL → LH → LL.
When you can draw that alternating pattern reliably on your timeframe, the trend is in control.
What are HH and HL (and LH / LL) — exact definitions
- Higher High (HH): a swing high that is higher than the previous swing high.
- Higher Low (HL): a swing low that is higher than the previous swing low.
- Lower High (LH): a swing high that is lower than the previous swing high.
- Lower Low (LL): a swing low that is lower than the previous swing low.
How to mark them practically:
- Identify the last clear swing high and swing low (use candle wicks or closes depending on your rule).
- Compare the next swings: if the high is above the last high → mark HH; if the low is above the last low → mark HL.
- Do this left-to-right — structure is about sequence, not single candles.
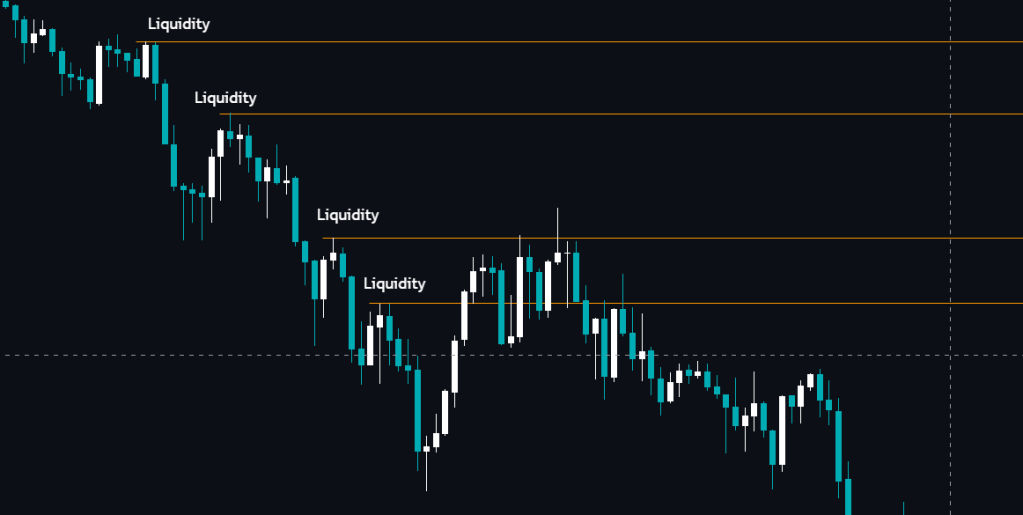
2. Liquidity — Where the Real Money Sits
Price doesn’t move randomly.
It moves toward areas where traders place:
- Stop-losses
- Breakout entries
- Pending orders
- Equal highs/lows
These areas are liquidity pools.
Large players use these zones to fill their orders.
This is why price often takes out a level first… and then moves away strongly.
Liquidity isn’t manipulation.
It’s simply the fuel the market runs on.
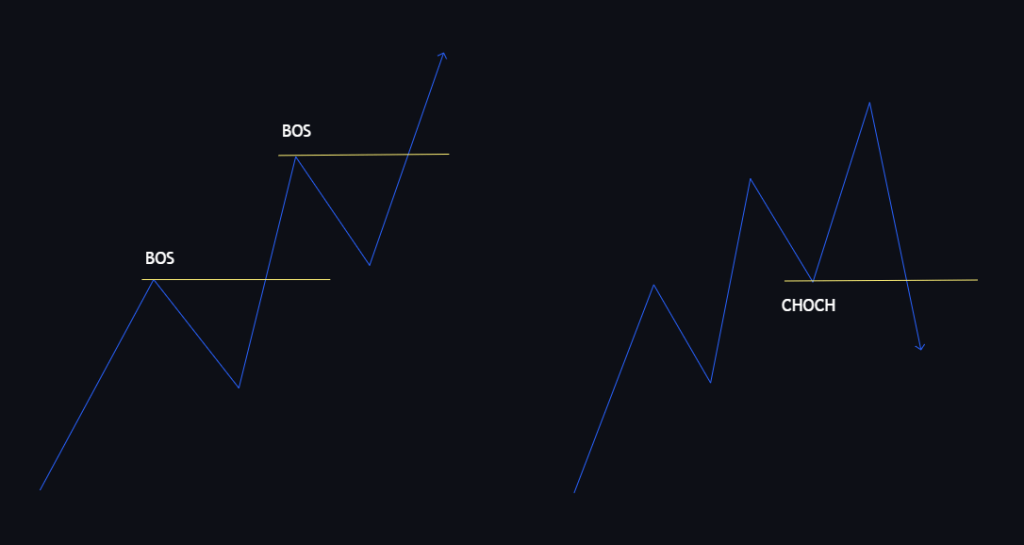
3. CHOCH & BOS — Signals of Directional Intent
These two show you how the market is shifting.
- BOS (Break of Structure): confirms the trend is continuing
- CHOCH (Change of Character): signals the trend might be changing
Think of CHOCH as an early alert.
Think of BOS as confirmation.
Together, they help you understand the true direction instead of trading emotionally.
How CHOCH forms (typical examples):
- In an uptrend, you’re watching HL → HH → HL → HH.
- A CHOCH happens when price fails to make a new HH and instead breaks the last HL (i.e., price closes or decisively moves below the last HL).
- Example: Uptrend sequence is HL1 → HH1 → HL2 → HH2. If price drops below HL, that break is a CHOCH. The market character changed from “buyers pushing higher” to “sellers can push lower.”
- In a downtrend, CHOCH is the opposite: price breaks above the last LH (the last lower high), showing buyers are gaining control.
Key points:
- CHOCH is usually earlier than a full trend reversal. It’s an alert: “watch this, structure is shifting.”
- It often follows a liquidity sweep or a big wick that clears stops — the institutions take liquidity then the CHOCH happens.
Relationship between CHOCH and BOS:
- CHOCH = early sign of structural change (often a break of a recent HL or LH).
- BOS = stronger confirmation (break and hold of a more important structural level, such as a larger swing high/low).
- In practice: CHOCH may warn you; BOS makes you act (confirmation for trend reversal or stronger continuation in the new direction).
4. Order Blocks — Institutional Decision Zones
Order Blocks mark the last strong candle before a major move.
They represent:
- High-volume decision points
- Unfilled institutional orders
- Areas price may revisit
Not every OB is valid.
We care only about clean, strong OBs backed by clear displacement.
When used correctly, they offer precise entry zones.
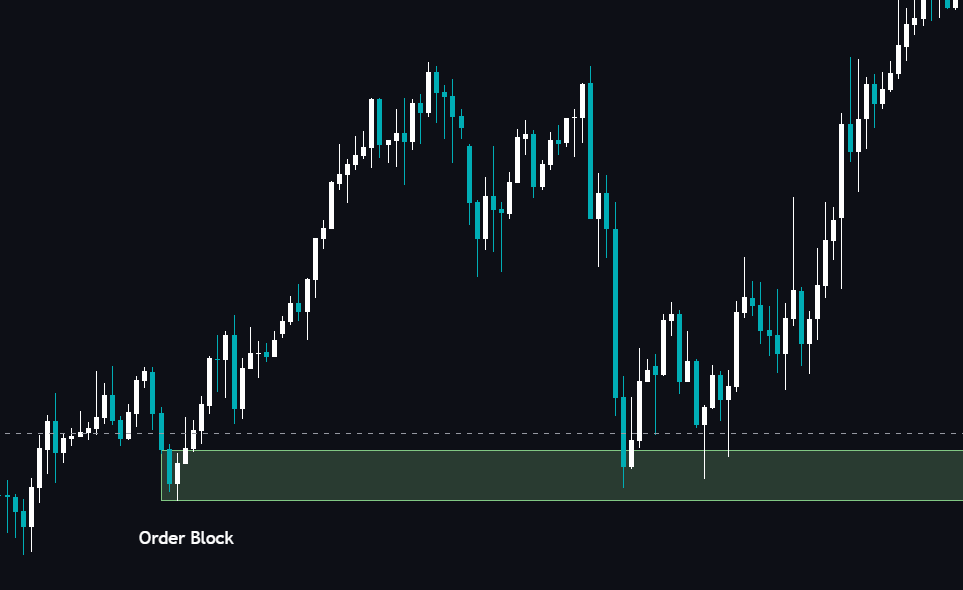
An Order Block (OB) is a large institutional decision zone — the last major buy candle before price drops, or the last major sell candle before price rallies.
It is not every random candle. It represents:
- Heavy accumulation or distribution by large players
- Areas where smart money opened or closed big positions
- Zones price often returns to for mitigation (filling unfilled orders)
Types of OBs
- Bullish Order Block: last down candle before an impulsive move upward
- Bearish Order Block: last up candle before an impulsive move downward
How an Order Block is formed
- Market consolidates or slows down.
- A final opposite-colored candle forms (down candle in bullish OB, up candle in bearish OB).
- Price leaves the zone with a strong displacement (fast, aggressive move).
- The area becomes a “memory zone” — price often revisits it to fill leftover orders.
How price interacts with OBs
- Price rallies or drops away from the OB (displacement)
- Later, price returns to the OB with reduced momentum
- Smart money re-enters or mitigates positions
- Structure often reacts from this zone with precision
What makes an OB valid
- Strong displacement after the candle
- Clear liquidity sweep before or inside the zone
- OB aligns with premium/discount logic
- OB is fresh (not retested multiple times)
5. Fair Value Gaps (FVG) — Imbalances That Price Wants to Fill
An FVG appears when price moves too quickly in one direction, leaving an imbalance.
Why they matter:
- Price often returns to “rebalance” the gap
- They act as high-probability pullback levels
- They combine perfectly with CHOCH
Smart traders wait for price to return to FVG instead of chasing candles.
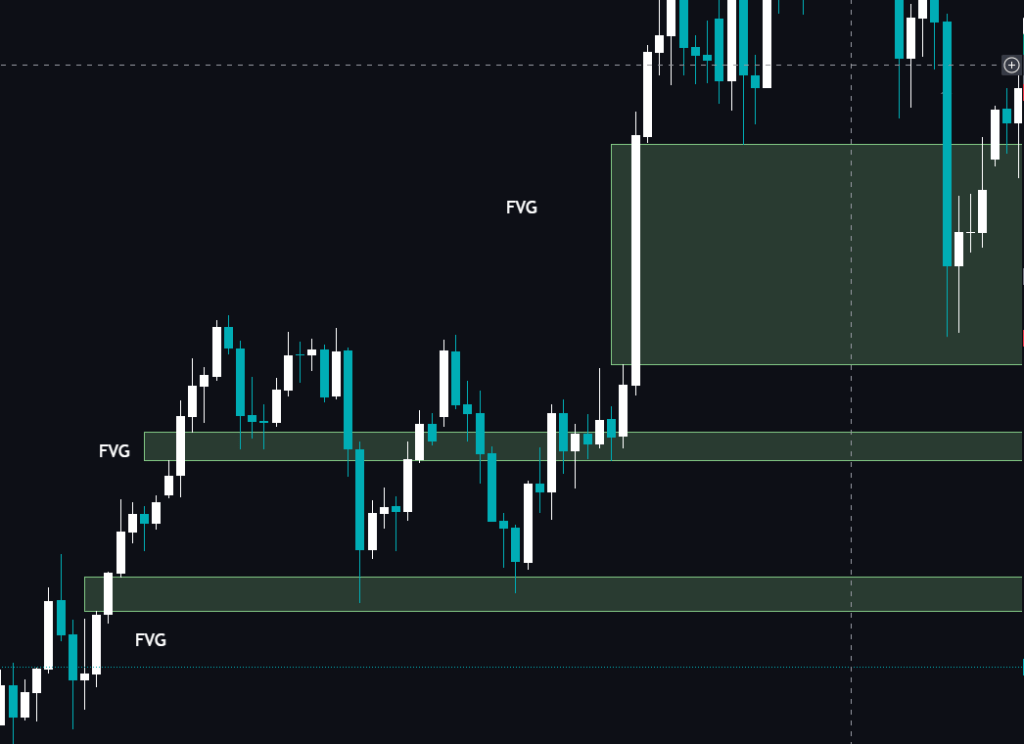
How FVG forms
Example:
- Candle 1 has a high at 100
- Candle 2 is a strong bullish candle with a low at 102 (gap between 100 → 102)
- Candle 3 also doesn’t return into that gap
This creates a Fair Value Gap.
It shows:
- Buyers/sellers moved aggressively
- The opposite side didn’t get a chance to trade
- Market may return to “rebalance” this area later
Why FVGs matter
- They are natural pullback zones
- They combine beautifully with CHOCH + BOS entries
- They show where institutional traders might re-enter
- They act like magnets — price often gravitates back to fill them
Types of FVG
- Bullish FVG: imbalance created during strong upward move
- Bearish FVG: imbalance created during strong downward move
High-probability FVG entries
The best FVG entries occur after:
- Liquidity sweep
- CHOCH
- Pullback into FVG inside premium/discount zone
- Confluence with OB or major structure level
6. Supply & Demand — Zones of Strong Reactions
These zones show where buyers or sellers previously stepped in aggressively.
- Demand: buyers dominated
- Supply: sellers dominated
In SMC, we look for:
- Strong displacement
- Clean, fresh zones
- Liquidity sitting near the level
These zones help forecast future reactions with better accuracy.
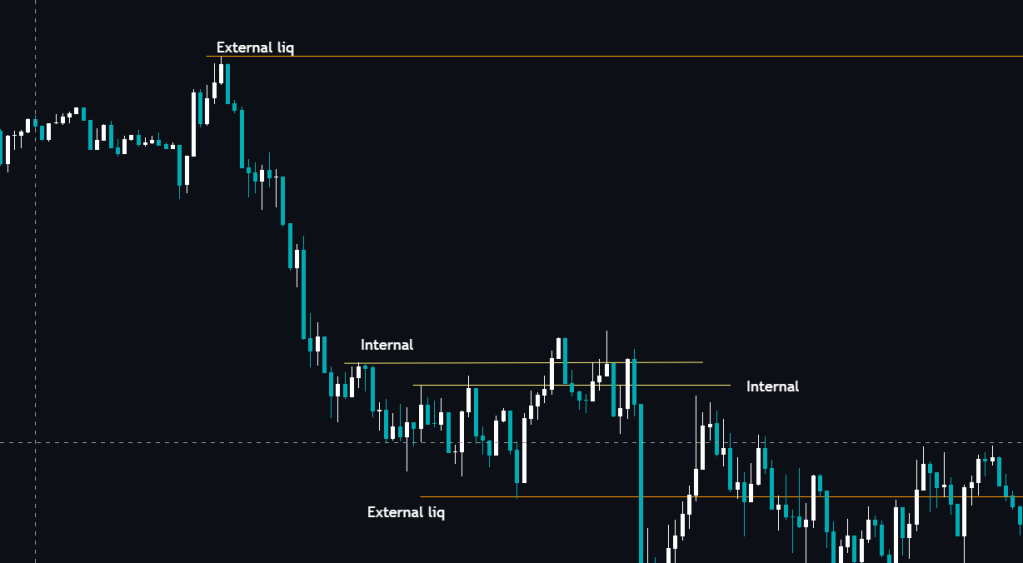
7. Internal vs External Liquidity — Understanding the Layers
Liquidity comes in two layers:
External Liquidity
Obvious swing highs/lows — major liquidity pools.
Internal Liquidity
Smaller equal highs/lows inside the range.
Price often clears internal liquidity before targeting the external level.
Understanding this helps predict the order in which levels will get targeted.
8. Premium & Discount Zones — Where Smart Money Trades
Trading without knowing premium/discount is like buying at the top of a bull market and wondering why it reverses.
In an uptrend:
- Discount zone = Buy area
- Premium zone = Avoid buying
In a downtrend:
- Premium zone = Sell area
- Discount zone = Avoid selling
This simple concept filters out low-quality trades and protects you from entering at the worst possible areas.
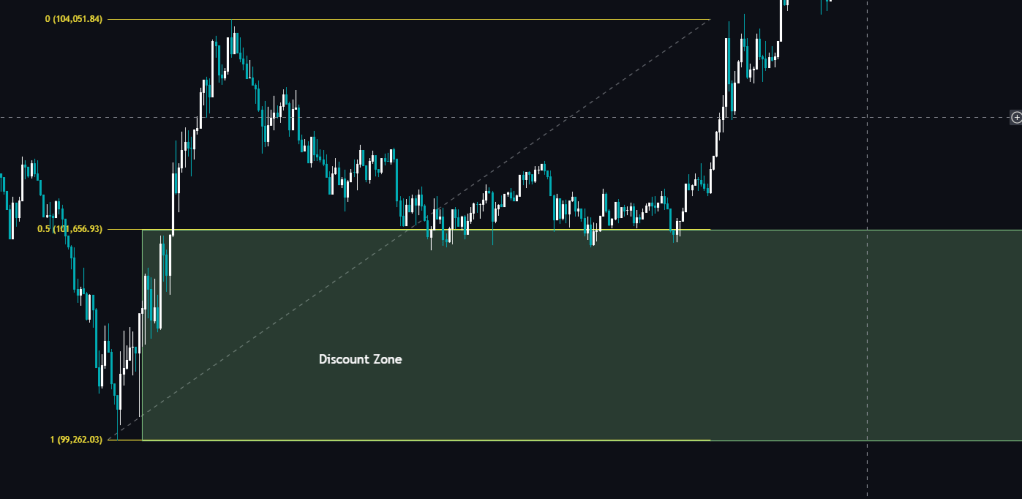
How to Identify Premium & Discount Zones
- Choose the swing range (use clear, clean structure):
- Identify the last significant swing low and swing high.
- Divide the range in half using a 50% midpoint level or Fibonacci 0.50 line.
- The 50% line splits the market into:
- Above 50% → Premium
- Below 50% → Discount
This works on every timeframe:
- 1-minute scalping
- 5-minute intraday
- 1-hour structure
- 4-hour swings
- Weekly ranges
The logic is universal.
Why Premium/Discount Matters
Institutions don’t buy at expensive prices, and they don’t sell at cheap prices.
They use discount areas to accumulate and premium areas to distribute.
Traders who ignore this:
- Enter longs at the peak of the move → become liquidity
- Enter shorts at the bottom → get hunted by reversals
- Think the trend “reversed” when actually they just traded in the wrong half of the range
This concept alone filters 60–70% of bad trades.
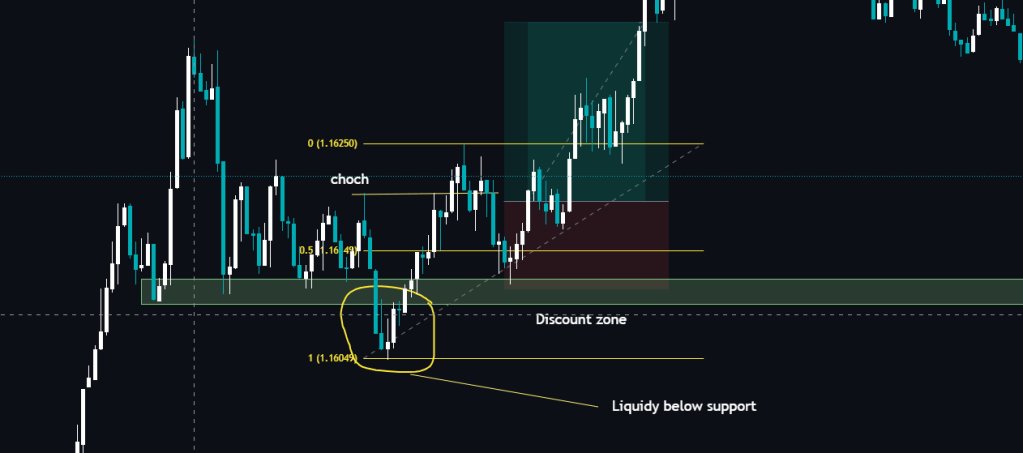
Example: Premium/Discount in an Uptrend
In an uptrend:
- We want to buy at Discount → below 50% of the range
- We expect the deepest pullback to happen inside Discount
- FVG + OB in Discount gives high-probability entry
- CHOCH must happen inside Discount to confirm reversal into continuation
9. The Smart Money Entry Model (Clean & Simple)
Almost every high-probability SMC setup follows this sequence:
- Liquidity is taken
- Market structure shifts (CHOCH)
- Price retraces
- Entry at FVG or Order Block
- SL placed beyond liquidity
- Target next liquidity level
This method gives clarity, structure, and purpose behind every entry.
SMC isn’t about memorizing fancy terms.
It’s about understanding why price behaves the way it does.
If you master:
- Structure
- Liquidity
- CHOCH
- OBs
- FVGs
- Zones
- Premium/Discount
You will see the chart with a clarity most traders never reach.
SMC is simple when learned the right way — and this page gives you the foundation to build real skill.
